2017
Chapter 3
Planning, Analysis and Assessment.
Mission statement.
The health director's first task is to develop a Mission Statement. This is a simple one-paragraph statement of the agency's function/purpose, such as:
“The mission of the City Health Department is to ensure that all citizens of 'This City' have access to health services that provide an opportunity to attain optimal health".
After writing a mission statement, you must develop a health department plan to support the mission. The plan will be composed of Goals and Objectives. All organizations have goals and objectives, whether they are written down explicitly, or exist informally as a set of ideas in the mind of the organization's leader(s). A mission statement, supported by goals and objectives gives the community a standard with accountability from which to judge the director's leadership and the department's actions (see “Trying is not good enough” Freidman M. at www.raguide.org click on the “browse the guide now” which takes you to the contents, look at the basic ideas underperforms accountability.)
A city council under the mayor's leadership, and a county government through the board of supervisors (or in some states the judge of the commissioner's court, a body identical in function to a board of supervisors) develops a mission statement for the elected officials and government, which should be supported by its own goals and objectives. Among these goals, one is usually to protect the public safety and welfare. Under the goal of public welfare there is usually an objective relating to public health services such as “provision of public health services including but not limited to maternal and child health services, chronic disease prevention and environmental safety. This city/county objective provides the basis for your agency's mission statement.
A mission statement should be developed with a local board of health (assuming you have one), though you may have to lead them through the various steps of goal and objective setting. See the Ten Essentials and the CDC PowerPoint show Updated 2014.
From Mission to Goals
Just as the local government's objectives led to development of your mission and goals, your department's objectives such as "ensuring prenatal care for all pregnant women" will lead to program goals within your department.
Goal and objective setting is a hierarchical exercise performed at all levels of government and business, from federal to local. Local government is the entity through which the federal and state governments usually put their goals and objectives into action to serve either individuals, or the community as a whole.
A Goal is a broad statement of direction for the long term.
An Objective is a specific, measurable, statement of actions, to be taken in a limited time.
The major difference between the two is the all-encompassing nature of a goal such as: "to improve maternal health," a general statement of policy direction.
From goals to objectives.
Objectives, as opposed to goals, have a limited time frame and include a measurable change. Your time limit should not be so short that you may only be measuring a fluctuation around the mean (typically a change in a state's infant mortality rate from one year to the next, rather than a change in a five year moving average). The measure has to have an associated time span such that any apparent change is real and relevant. You may have to study a trend line to decide whether the program in question actually caused the change, or whether the change would have occurred anyway. It is as important not to take credit for naturally occurring events, as it is to claim responsibility for outcomes that resulted from your department's activities. The CDC Office of Public Health Practice provides standards you can use for setting local objectives and goals (focus on the LHD goals, click on the link to local P. H. practices..
The ability to reach an objective depends on available resources. Thus, you should develop both long- and short-range plans. Local government normally budgets over a twelve-month period. State governments may budget on a one-year or two-year cycle. In the latter case, the first year is the base year in which major changes in policy initiatives and supported funding occur. The second year is used to correct miscalculations that may have been made the first year. Because of inertia many federal agencies, particularly the military, may use a time frame of 25 years for long-range planning and 5 years for short-range planning. Nonetheless, congressional committees keep tinkering from year to year! Because it is difficult to obtain useful data for most health planning objectives in a single year, five years may be the shortest time period in which data is likely to show changes in response to policy initiatives. Although congress approves annual budgets, most of the major budget changes reflect policy redirection stemming from presidential elections. Even at the state and local level, the budgets necessary to support policy changes are often influenced by elections and perceptions rather than by evidence
Consistency in policy application is difficult at the local level where elections often take place every two years, unless the same cast is re-elected each time. Where a jurisdictional manager is appointed, (the strong-manager form of government), as opposed to a chief operating officer who is elected (the strong-mayor form of government) there is likely to be more continuity of policy from year to year. Based on a careful analysis of your community's health status and needs, with an understanding of the difference between these forms of governance, it is essential to present plans and related policies with careful forethought. Consider the operational behavior of your chief executive.
Developing a planning team.
The first step is to weld a strong team together. It should include your senior staff, local government specialists such as the community planner and information systems manager, and your immediate supervisor, if this is not the county or city manager. To reduce the span of control, the city or county manager usually has several deputies, one of whom will usually be responsible for the human service agencies such as health, mental health, social services and recreation. Other deputies will be responsible for public safety, or for water, sewer and solid waste disposal. In multi-county or city-county districts at least one deputy or assistant manager from each jurisdiction should be part of the planning team. Including senior staff from the different local governments within a health district will improve the credibility of your plan and increase the likelihood of its acceptance without major changes, once presented for adoption and funding. Enabling different representatives to critique and suggest changes during development of the plan facilitates its acceptance. It is useful to obtain advice from groups of people likely to be affected by the plan, the 'stakeholders'. These are people with special health/medical interests, also those with environmental concerns. This opportunity to provide constructive criticism during the plan's development builds support from those likely to be affected by it. Besides community groups, it is essential that your staff, particularly field staff, be given a chance to recommend goals and objectives for the department's long range plans. Once a valid long-range plan to meet the community's health needs has been developed, and revised once, future revisions will take less work. Doing the job right, the first time, takes a major effort from all concerned.
Using the "Model Standards".
Major tools for developing Community Health Goals include a planning manual developed jointly by the Centers for Disease Control (CDC), the American Public Health Association (APHA), the Association of State & Territorial Health Officers (ASTHO), the National Association of City and County Health Officers (NACHO). This used to be the "Model Standards: Guide for Community Preventive Health Services". The latest version was released in the spring of 2001 (last modified in October 2008) and became the 'National Public Health Performance Standards Program’ once you reach this website click on the NPHPS fact sheet. The is the public health partner to the 'US Preventive Services Task Force’ reports. The CDC has changed it’s focus to indicate that the publication is a framework, not of 'standards' but of “model” goals and objectives in a standard format, developed in coordination with the National Association of City and County Health Officers. The approach is comprehensive and covers all areas of public health. Just as for the Healthy People 2020, each recommendation is associated with data indicating the strength of research upon which the recommendation is based. Because the recommendations are now based on evidence rather than past activities the measurements are moving toward outcome, rather than process, based.
The revision to the “model” standards are closely linked to the 'Healthy People' documents, the latest being “Healthy People 2020" which provides goal statements and objectives which cover 42 topic areas (goals) and 1200 objectives (click on the ‘topics & discussions’ tab) that can be adopted, usually with little or no change by local health departments; examples are given in the section on program analyses. Small departments with scant resources probably will want to combine some of the goals, reduce the number of objectives and modify the expected outcomes. Healthy People divides each goal into several "major” topic areas (past editions had ‘focus areas’) each of which has one or more outcome objectives. The first page of the MCH area is shown as an example. Each objective in the document is cross-referenced, where necessary, to other goals and objectives. This has been an evolving process since the 1970s. For example, objectives to improve early and middle childhood health now have their own specific section Objectives for delivery of maternal health services may complement those intended to ensure health maintenance for women or to reduce births of children with developmental disabilities. Finally CDC’s NPHSP has developed a Version 2 of its Assessment Instruments (2008-2013) for local planning and assessment, focus on the ‘local instruments’ section.
Low tech and high tech.
Another critical issue that affects national and state priorities is the increasing cost of delivering "high tech" health care to an entire population. When the total health care costs were 8-9 percent of the Gross National Product (GNP) there was little complaint about cost. Now it has reached 18% and is likely to increase further. In May of 2000 the WHO released its studies on effectiveness (See pages 13 and 58) of national health care systems. (this has been enhanced by studies on accountability) Japan came in first, the US 34th. Although the proportion of the GNP used to provide medical care in the US is greater than in any other country in the world, it now competes with money that could be used for investment to produce jobs in the industries that support the service sector (which includes health). In November 2007 the Commonwealth Fund (CF) released a similar survey looking at high performance health systems and comparing the US with 6 other developed Countries, look at the studies from the CF on Health System Performance The USA came in a dismal last place! The CF also produced a Chartbook of comparisons among Health Data Systems for 2006 Look at chapter 2. The European Health Atlas was released in December 2008. All these references provide a starting point for evaluating the quality of the US Health System. For many people, medical care expenditures compete with the purchase of food, education, housing, transportation and other essentials of daily life. Because of improvements in general health and a delayed death rates chronic diseases, and the elderly are the fastest growing health issues/segment of our population, and make the greatest demands on the health care system. At the other extreme of life, small babies born early in the third trimester survive at great cost in NICUs, though we fail to provide basic health services to every pregnant woman. The move by obstetricians to induce labor when convenient, rather than wait for a natural outcome may well be part of this problem. More children are being diagnosed earlier with moderate developmental disabilities. The federal government enacts mandates for costly remedial services without providing the resources to prevent the disabilities from occurring in the first place.
The incurred high cost of medical care, generated partly by high technology, but more by increased longevity and associated increased prevalence of chronic diseases has started to reawaken an interest in health planning (population health). Moreover, the focus now is on "health" planning rather than "medical care" planning, underpinned by the use of evidence of effectiveness, rather than efficiency, Outcome versus Process. As the federal government recognizes the limits of available resources, it tends to focus more on constitutional mandates such as international relations, defense, and social security. Looking at some key measures such as infant mortality and life expectancy, health planners find that, despite its high technology, the U.S. has nowhere near the best health outcomes, when measured by morbidity and mortality (let alone cost effectiveness). International data on distribution of morbidity and mortality do not show any value in having a 50-100% greater proportion of the GNP devoted to medical care in the U.S. Political and business leaders at all levels are beginning to recommend policies that will reduce expenditures for medical care, although there is general agreement that a basic minimum of medical services should be provided to all people. See the most recent IOM study (2013). A focus on preventing disease has still not become generally acceptable in this country except for those covered by the ACA. Currently the debate is about tweaking the law (Affordable Care Act) and ensuring that all citizens have access to all necessary health services, despite lack of controls on the system. This will inevitably cause the system to spiral further out of control; current % of GNP is 18%+ (2014) and based on the 2016 election of the new president and Congress they can expect to see further turmoil in the healthcare segment of US policy..
The issues have become more important as we move further into the epidemic of chronic diseases. In 2008 there were 100 million U.S. citizens with one or more chronic diseases, for those over 65, eighty eight percent have at least one chronic disease. 75% of the national health budget goes to chronic disease care. Within 10 - 15 years there are expectations that without change the share of the GNP devoted to “health” will be 25% instead of the current 18+%. The current European average is 9%, although their outcomes are superior to ours.
Planning failure, while the world changes.
The climate for goal setting in the health care arena is very different at the end of the first decade of the 3rd Millennium, compared to the late 1960s through the early 1980s. In the 1970s there was little concern for limiting social spending. The Regional Medical Programs offered treatment for cancer, heart disease and stroke without any relation to the rest of the medical care infrastructure, or a concern for prevention. Emphasis on specific diseases changed to a focus on state and regional health planning systems. Despite this shift, costs kept increasing. Money was given to local communities for many kinds of new programs, but little effort was put into evaluation. The public health establishment contributed to the problem by embracing programs without much effort to evaluate effectiveness, let alone efficiency.
Shifting from federal to state planning
With the loss of federal support for regional and state health planning agencies, it has become even more important for departments of public health at all levels to develop credible health status assessment and plans to improve health. Public health departments can no longer plan for only traditional public health programs, but must develop coordinated, comprehensive plans that target reduction of disease, disability and death Planning starts by analyzing the population distribution, gathering data about prevalence of disease, and access to primary care services. The initial focus should be on prevention and access to an integrated health and medical delivery system. Using this approach, health departments do not have to deliver all the services; they do have the responsibility to plan for them. This is the assurance function of the health department, described so well in the Institute of Medicine's 1988 "The Future of Public Health" This approach to planning health services for the entire community is even more important as we enter the 2010s with some 45+ million Americans (about 15% of the total population) lacking health insurance. Many of these are employed, often at minimum wages, without insurance provided by their employer. Many are neither insured nor employed, yet are not eligible for Medicaid because they don't fit into one of the designated categories; social security beneficiaries, permanently disabled, old aged, pregnant women or children. Community-wide comprehensive planning is particularly necessary in rural areas where residents are losing access to primary care. Physicians, concerned about medical liability costs, are not providing services with a potential for litigation, such as obstetrics. . As physicians reduce the scope of their practice they move to the suburbs, do not locate in rural & center city areas or go into a specialty practice. The Institute of Medicine updated the “Future” in its 2003 publication “The Future of the Public’s Health in the 21st Century”
Short term vs. long term health policy making.
The problems cited above reflect the failure of health care policy-makers to look at long-term changes while continuing to react to short term problems. After World War II we built many rural hospitals to attract physicians, rather than analyzing the epidemiology of disease and disability to determine resources needed and their proper location. Now some facilities have more than 40% of their beds empty while there is evidence we have an excess of specialty physicians by 50%. The physicians we do have are trained in specialty care while we have a major shortage of primary care physicians. We built new hospitals because we thought there was a bed shortage. Then we built new medical schools and have produced so many doctors that a review by the American College of Surgeons showed that there was enough work to provide each surgeon with only 1-2 “hernia equivalents” of surgery a day.
If we had a distribution of physicians similar to other developed countries (1 generalist for each 2000 people and 1 specialist for each 3 generalists) we would we would be able to manage with the over 780,000+ currently in practice, many chasing too little work (Parkinson's second law!). Then, we found that too many older people could not afford care. We enacted Medicare which focuses on acute care rather amelioration and prevention of chronic diseases. We focused on payment for services delivered rather than analyzing services needed. Instead of developing clear long-term national and state policies, based on health services planning, we reacted to each media event of the week. Current 'health' policy is based on a reaction to group perception (not logical planning). The media glamorizes research rather than focusing on the value of funding currently effective methods. Infant mortality, although improving greatly is still too high, compared with other developed countries. We know how to reduce infant death rates and increase the likelihood that nearly all children will be born healthy, but we keep pouring money into neonatal intensive care units (NICUs.) instead of funding basic prenatal care. There is not enough money to do both. NICU’s photo opportunities make better theater than a well-baby. The media continue to lavish attention on the desperate state of one child needing a transplant, which is always expensive and often likely to have limited success. The same amount of money might be used to provide prenatal care to 500 pregnant women preventing deaths, mental retardation, and developmental disabilities.
Responsible planning includes educating the public about limited and hard choices that have to be made. The process requires improvements in both the planning process and presenting the goals and objectives, to motivate the public to elect leaders likely to make informed choices about health programs. The skills for these activities should be available in every health department. A health director's most important task is to provide this leadership.
Basic Planning Data.
This lack of comprehensive national, state and regional health (as opposed to medical) planning, and the overuse of high technology, has created a gap which public health departments have a responsibility to fill. Many other countries have kept medical care costs relatively low by focusing on primary care and preventive medicine as the foundation of their health care programs. As a prelude to the planning process it is useful to review certain data.
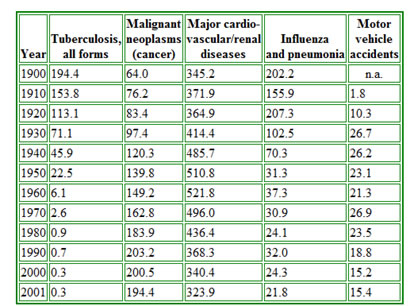
Figure 1, (below), shows the changes in the leading causes of death in the United States between 1900 and 2001. This continues to change, see the leading causes for 2002. Look at why patients go to doctors NAMCS web Tables (select first link for 2010 - See page 3.) All the diagnoses identified are for conditions commonly seen in primary care practice. Almost forty years ago Kerr White (3) showed that in any month, for any 1000 persons in the U.S., 250 had symptoms of disease. Of these 100 went to a primary care physician, 9 were hospitalized, five received a consultation but only 1 was referred to a tertiary care center. Such data suggest that health planners should focus on better ways to improve access to primary care and while targeting the maximum use of interventions to prevent the development of chronic diseases. A recent update of Kerr White's work [Figure 2], by the American Academy of Family Physicians shows that there has been little change in primary care access since 1960.
figure 1-leading causes of death 1900 to 2001
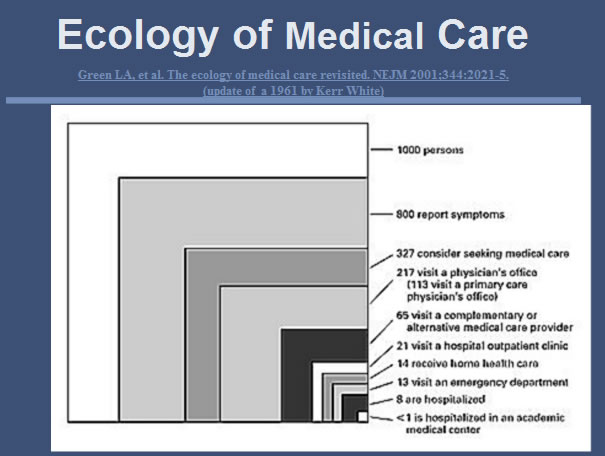
Figure 2. Update to Kerr White’s Study by AAFP, 2006
Finally the CDC/NCHS publishes annual reports on trends in health statistics as “Health United States 20xx.”
Over the last 15 years the incidence of death from stroke has dropped almost 60 percent, while coronary heart disease deaths have dropped more than a 40 percent (for men, for women CHD deaths are rising). Stroke related deaths dropped following efforts to find people with untreated hypertension and treat their high blood pressure before symptoms occurred. The reduction in coronary heart disease deaths has been associated with a number of early interventions, mostly discovered by the Framingham Heart Disease study. Recent interventions to reduce high serum lipid levels should reduce coronary disease still further. These lower death rates are the result of good research, good planning; effective programs and leadership from the CDC and the National Institutes for Health (NIH). Many other deaths from chronic diseases can be averted by application of known public health principles.
Planning for different age groups.
Distinct from the improving health status of the middle aged is the poor health status of many elderly persons. The fastest growing segment of the population is the aged, especially those over 85. Many previously competing causes for death, at younger ages, except for intentional and unintentional injury, have disappeared. People are living longer, but not necessarily better. Alzheimer's disease, rarely diagnosed 10-15 years ago, is now commonly found among residents of nursing homes. National nursing home surveys show in the Advanced Data publication show that many residents in nursing homes suffer from some form of dementia, the majority with Alzheimer's disease. Older people now live
Planning for different age groups.
Distinct from the improving health status of the middle aged is the poor health status of many elderly persons. The fastest growing segment of the population is the aged, especially those over 85. Many previously competing causes for death, at younger ages, except for intentional and unintentional injury, have disappeared. People are living longer, but not necessarily better. Alzheimer's disease, rarely diagnosed 10-15 years ago, is now commonly found among residents of nursing homes. National nursing home surveys show that many residents in nursing homes suffer from some form of dementia, the majority with Alzheimer's disease. Older people now live with fewer physical problems, but more mental problems requiring institutionalization. Note that this most of this data comes from surveys now almost 10 years old and lack data that would be useful for planning nursing homes services for a community, in relation to other options. Some who have chronic renal disease are kept alive with expensive transplants and dialysis. Care for the elderly now accounts for 70% of Medicaid costs, the fastest growth segment in state budgets. This changing focus from an emphasis on curing diseases of middle age to caring for diseases of old age caught health planners and economists in the US by surprise, and is a major reason for the increasing costs for providing medical care. These changes should have been anticipated, but federal and state health planners spent their time planning how to restrict new hospital and nursing home beds instead of using epidemiologic methods to study the future need for health and medical services, based on the changing distribution of disease and morbidity. Additionally, they fail to study systems in other countries. The U.S. seems to have an institutional arrogance to ignore international studies as irrelevant to us. Those interested in following up this topic should obtain the PBS series on DVD: Living Old, The Modern Realities of Aging in America. The recently enacted Affordable Care Act has a focus on prevention and chronic disease which may help. However the details are lacking.
The community health plan. There
To assess community health needs (community health status), complete with goals and objectives; first gather morbidity & mortality data to evaluate distribution of diseases and deaths. Use this data to identify needs rather than expressed desires. Once the data is gathered, analyze them and rank the problems by numbers of diseases and deaths, and the department's ability to intervene successfully. Examine the cost of intervention and access to available technology. Develop an algorithm that takes all these variables into account to provide a simple rank order. Cost can be measured in terms of medical care only, or by adding in all the social support mechanisms put into place if care is not given. When you have ranked the conditions define the goals necessary to change health status for each problem. After defining the goals, select the objectives (or tasks) necessary to meet the goals. Certain goals, while praise worthy, may have no measurable outcome associated with a planned objective. First, do the things you know how to do, then plan research necessary to intervene in other areas. Public health should not be considered a "do good" activity, but an application of medicine that improves and maintains health with clearly visible, tangible results. (Also see the executive summary of the of the CDC’s Principles of Community Engagement). New resources that are particularly useful in developing community health plans include data found at Community Health Status Indicators (CHSI) which provide an overview of key health indicators for local communities. There is considerable additional data on state health department webs sites such as that in Virginia. The Robert Wood Johnson Foundation and the University of Wisconsin have just completed a joint program, to compare with the RWJF health of all counties/jurisdictions in the US,
Efficiency or effectiveness?
Once you have a list of goals and objectives review them for their combined effectiveness and efficiency. There is excellent data on the value of immunizing against communicable diseases and providing treatment for sexually transmissible diseases available from the Centers for Disease Control. Data on providing maternity care and many other public health clinical activities has been well documented in publications of the Institute of Medicine, the Guttmacher Institute, the Children's Defense Fund and the American Public Health Association. Although a program may be efficient (takes minimal money in relation to activities) it may be ineffective (shows no outcome change) and therefore is a waste of money. First: be sure that an activity necessary to carry out an objective is effective; otherwise lower the priority for the objective within the plan. When you have completed this review and check your priorities again. While this topic focuses on local health departments the Dartmouth Atlas project compares state & county health financial outcomes (look at the spotlight section to the top right) go to sleep go to sleep.
While assessing the department's ability to use various preventive interventions such as immunization, prenatal care, and family planning also consider problems that require personal behavioral changes such as eating, drinking, exercising and wearing seat belts. Examine what can be done by environmental intervention such as installing sewage and potable water systems, or restaurant inspections. These traditional public health practices have minimal cost compared with providing medical care. They can provide a rapid response to many community needs.
Review data on death, disability and disease to determine which problems will respond to additional intervention by primary care providers such as family doctors, pediatricians, general internists and obstetrician-gynecologists. Lack of primary physicians may make it impossible to respond to community health needs. A community health status assessment may reveal problems, which requires you to help community leaders develop long-term goals to support short-term public health activities. The WHO focuses on inter-country comparisons the CDC’s NCHS publishes an annual Health United States. Assessment. The latest is rapid for 2015.
Budgeting.
Having collected data, analyzed the data, validated your objectives and set goal priorities you are ready to develop a budget. Budget development is discussed in the next lecture. A budget presentation is the culmination of the planning effort. The budget adopted by your local government demonstrates the effectiveness of your health plan, which is in competition with plans of all the other government departments. The funded, as opposed to presented, budget is a measure of your organization's credibility. Part of the decision-making to fund your budget depends on how effectively your department markets its services.
Validating objectives to the community.
A difficult problem, discussed in the chapter on 'communication', is how to obtain funds for programs which, when working well, have no 'obvious' outcome. For example: When most children are immunized there are no children dying from measles encephalitis. When a food service program works well there are no outbreaks of food related illness.
Many people over 60 years of age can remember the iron lungs used to treat poliomyelitis. Young pediatricians and generalists (under 35) may never have seen a case of polio, measles, rubella, whooping cough, mumps or diphtheria. Neither they, nor younger legislators, can remember children who died or were disabled permanently by many of these diseases.
Competing with other agencies.
You compete for resources with agencies whose 'time has come,' by popular demand. Although many of these agency's programs have not been proven successful, the public and the politicians they elect may deem them valuable. An example could be a program to curb alcoholism. Despite public acclaim, there is little scientific data to show that any government-sponsored programs are as good as Alcoholics Anonymous, which gets no public funding.
Three of the most important ongoing tasks for a health director are:
These three tasks form a constant inter-related cycle upon which all else depends. You can't get resources without communicating the need and a clear plan of action. You cannot plan without careful analysis of the community's needs.
DATA COLLECTION.
This is the first step in planning. You and your staff will know, generally, what the health status of the community is from your contacts with doctors, nurses, dentists, school principals, hospitals, nursing homes, the news media, your clients and your bosses. Larger health departments have their own laboratories, vital statisticians, health educators, nutritionists, engineers, soil scientists, administrators, social workers and other staff with contacts in the community who can collect data. Further use the data described above that provides baseline national and state comparisons to compare with your data.
Preparing the written report.
Start by preparing a general summary of health conditions in the community. You will know from records, also from the state health department, what the major causes of death are in your jurisdiction. Other agencies can provide information about disabilities. National health surveys, mostly carried out by the National Center for Health Statistics, tell you who died from what, at what age, by sex, race and regional location. Besides deaths these surveys include data on perceived health status from the "health interview surveys", on actual health and nutrition status from the "health and nutrition examination surveys". Data is also available from the "national hospital discharge data surveys" nursing home surveys, family planning surveys and from the "national ambulatory medical care surveys". As health departments become more involved in preventing chronic disease the Behavioral Risk Factor Surveillance systems (BRFSS) are essential to develop baseline for progress. The latter examine why patients go to doctor's offices, what their diagnoses are and what treatment is recommended. National data should be used to develop "synthetic data sets" for the community, by adjusting the population data in the national survey to the local population by age, race, national origin and sex in your community. This data can be used to comparison actual data from your community with national data, to see whether the expected patterns exist. If not, you need to look further to determine why not.
Collecting data.
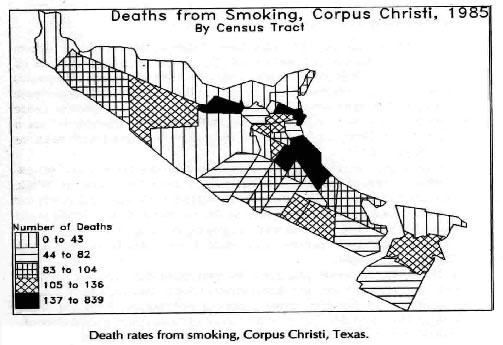
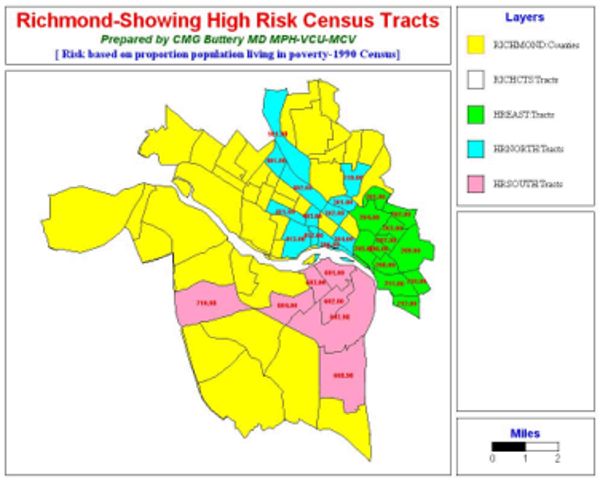
Those who work in a department where data has been kept by census tracts for several years are fortunate. Most national and regional health surveys collect data by areas as small as census tracts. Few local health departments have done this routinely. Such collection allows comparison of socio-economic data to be aggregated from census tracts and compared to national data. View two sets of health characteristics, one from Corpus Christi, Texas and the other from Virginia.
 is
is
Figure 3
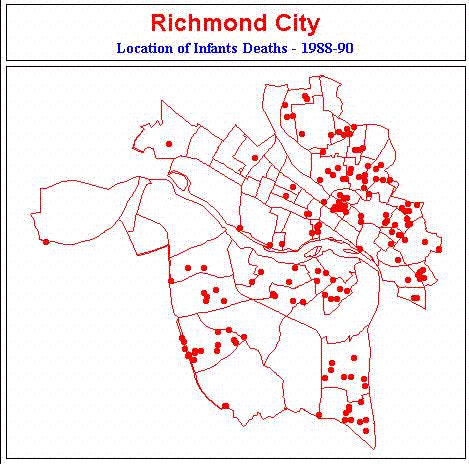
Figure 4
The maps show incidents by census tracts. Mapping of health events enables one to look at the distribution of events by population groups. Geographic analysis is an important tool used by epidemiologists to analyze disease distribution. We have come a long way in geographic analysis since that shown in the first chart from 1985 where I wrote the programming in “ graphics basic “ to the second one developed using ATLAS software now replaced by data from ESRI. All large urban areas are part of Metropolitan Statistical Areas (MSAs). These areas are used by many government agencies to collect data about respective interests such as housing, small business, and economic development (E.G. City of Richmond, VA - Maps & data). Most data about people, collected by government, are aggregated by census tracts as the smallest area that will not identify the individuals concerned. Some rural areas have not been mapped by census districts but use similar aggregations of people called "enumeration districts". Areas smaller than census tracts are rarely used for public health purposes because the denominator and nominator are too small. Summary data collected at less than the census tract level produce small numerators for calculating rates.
When the numerator is small the analysis is usually inconclusive and leads to erroneous conclusions. Some local health departments and other local agencies collect data by census tracts. This allows different agencies to correlate data from different databases to develop better plans. For example some local health departments already code births, deaths, attendance at clinics and location of environmental visits by census tracts. Planning departments usually have a wealth of economic and physical data coded by census tracts. These datasets can be matched up to make more comprehensive analyses. Older data collected by zip code rarely correspond to census tract data developed to identify neighborhoods. Sometimes boundaries change between decennial censuses so that data collected from two consecutive decennial censuses are not comparable. Even when census tracts boundaries remain intact, population growth, changes in housing patterns from single to multi-family dwellings, land use from housing to industry, or slum clearance all affect denominator data used to calculate rates. In some parts of the country floods and hurricanes occur regularly enough to alter denominators between census surveys. These changes reduce comparability of data from decade to decade, and at times within a single decade. Local officials must be aware of other community changes so that data can be adjusted accordingly, to allow realistic inferences to be made about the need for health services. Most population based planning data are good for the time of the survey, two years before and two years afterwards. If you wait much longer you probably need to perform a new survey, unless the neighborhood is very stable. Many communities have building officials who keep track of new, condemned, and removed buildings. They also know when buildings are converted from single to multi-family use. This information is all useful in evaluating neighborhood changes.
Before beginning an analysis, you must examine the socio-economic content of the community. Certain diseases are more likely to occur in certain socio-economic neighborhoods. Sexually transmitted diseases, tuberculosis (part of the first grant from CDC to a locality to investigate socioeconomic differences and associated diseases, in the 1960s), and enteric diseases are far more likely to occur in low-income neighborhoods where education is often less than 9th grade. In high-income neighborhoods where people live to an older age, chronic diseases such as heart disease, stroke and arthritis are of more concern. While the map shown was developed 40 years ago many communities are still not using this easily available technology.
Locating the Data.
Additional socio-economic data are available from planning and social service departments. Utility departments know who has and does not have electrical and water hook-ups. Waste management services know about garbage pickups by amount and type. The telephone company knows who has telephones. Your roads department knows about access to various facilities and the barriers people have to cross to get to services. The postal service knows how many families in a neighborhood receive mail.
School principals have information about numbers of families and children by neighborhood, the health status of their pupils, and the children's nutritional status. In many communities the school nurses are employees of local health departments. They can identify which children need special education and physical resources and their immunization levels. The school nurses, in addition to having information about children's health needs know about the entire family of many of these children. The public health dentist knows about the need for children's dental care.
Medicaid and Medicare expenditures and services provided in a community are now often available online, either from your state Medicaid office or HCFA. The Kaiser Family Foundation also provides excellent summaries of Medicare and Medicaid impacts on their y recipients. Data reveals the proportion of low-income persons receiving categorical health services and helps define the remaining need for financial access to health services. The Kaiser Foundation also has a site for comparative State Health Facts. Besides all the information on living arrangements, social support systems, and educational capabilities, clinic charts contain other facts about the people who visit the department's various clinics. Clinical data can often be obtained from HMOs.and State agencies, in addition to the NCHS panoply of surveys. Another valuable place to look is the Dartmouth Atlas of healthcare which provides comparative data on outcome for both hospitals and communities.
Data on environmental needs are estimated from knowledge about the distribution of the various food service places, as well as location of homes on private waste disposal and water systems and those homes connected to public systems. The location of health facilities such as hospitals, nursing homes and doctors’ offices and the travel time to these facilities; as well as occupancy level of the various facilities and their range of services are important data. Information about aggregate discharge and treatment data by disease category are useful in evaluation availability of services. Increasingly hospitals are being expected to take part in community planning as part of their mission.
Analyzing the Data.
In poorly computerized community data systems you work with paper printouts and transfer aggregate data to spread sheets manually. These are still found in many local health departments in 2013. In better-organized health departments much data can be found in electronic spreadsheet format. Much of the local information will be numerator data about incidents of disease or environmental hazards. The denominator data of persons at risk comes from the community planning department's surveys or statistical projections. Check the sources of all data you receive to validate its accuracy. Compare numbers and rates for events such as births, deaths, and diseases. Rates are less likely to change because of changes in housing stock. They can be compared between appropriate communities to decide whether a change would have occurred despite the department's programs or whether the change was a result of programs.
Rates and numbers.
When reviewing rates you must examine both the numerator and denominator data used in the calculations. Frequently individuals unused to analyzing incidence or prevalence rates come to false conclusions. For example; a census tract with 10,000 people and a gonorrhea rate of 50/1000/year has 500 cases of gonorrhea per year. A census tract with only 2000 people and the same rate contains only 100 infected people. One may forget that the second census tract only requires one-fifth the control effort of the first. In a second instance a census tract with 5000 people, and a young population (between 15 and 25) with an attack rate only 50 percent that of the first group may have the same number of cases as the census tract with 10,000 people. Here the problem will be more difficult to control than in the first example. It is hard to change risky behavior of adolescents. These distinctions are an important part of community epidemiology and planning. You must know the population distributions by age, sex, race, and other attributes, which can influence the health problems under examination. It is vital to standardize (age adjust) populations in different areas within a community and to be able to explain these differences to the community.
Incidence.
It is particularly important to look at incidence (new cases) for acute problems such as gonorrhea, encephalitis, or injuries. For the chronic diseases such as Tb or Heart disease, and AIDS examine both incidence and prevalence. A disease with low incidence, but relatively high prevalence may require a different approach to one with both low incidence and low prevalence. The age at which symptoms of disease and concomitant disability occur is important. The measures you take, and the community perception, may be different for diseases which occur in children or young adults, compared to those which affect older people. The amount of incapacity and the guardianship needed changes for different health problems, as do public perceptions. AIDS and Alzheimer's disease both cause serious disability. Dementias occur in older populations whose behavior might not seem related to the disease. Both may require an increasing amount of guardianship. Both have a drawn out clinical period. The public sympathy may be greater for the Alzheimer's patient than for the AIDS patient. With current knowledge AIDS is preventable, Alzheimer's disease is not. One of the problems with using hospital data is that poor coding and address information mean that the data is representative only of those people admitted to the hospital and cannot be used for community assessment.
From crude to specific data. After calculating crude incidence rates for a disease the next procedure is age adjustment by census tracts, or neighborhoods by economic levels. In the maps shown, the census tracts, colored by high-risk or low-income, have relatively homogeneous populations. Different strategies for access to primary care were developed for each differently colored aggregate. Once the basis for the grouping is decided standardize the population to the same age, sex, and race distribution. This allows risk of specific diseases and health problems among different population groups in the community to be compared to the community as a whole. The resulting data can then be compared with representative state and national figures. The more careful the comparisons the more likely you are to be able to tell the story of why various health problems occur in your community, what can be done to correct them and what resources are needed. A standard population, useful for age adjustment, can be any population for which there is good data. Alternatively a "synthetic" population can be generated. The denominator for calculating this population depends on the denominator used when reporting the particular problem. It may be as small as 1000 for infant mortality and family planning or as much as 100,000 for deaths and infections. It is essential to use similar denominators for each population you intend to analyze.
Using data to answer citizen complaints.
Data is particularly useful when a special interest occurs for a specific problem. For example, a citizen may claim that her husband died of cancer and that "many" people in her neighborhood had died of cancer. In a real case in Corpus Christi, TX, an individual lived downwind from a refinery and across the street from a battery disposal plant. She stated, at a city council meeting, that not only her husband but also everyone on her block was dying from lung cancer. Department staff examined the incidence of cancer deaths in this block, the neighborhood, the entire census tract, the surrounding tracts, and the city as a whole. Data for the preceding 15 years was examined using five years groupings (cohorts) so the numerator would be large enough for valid comparison. This census tract was compared with other census tracts downwind from refineries and industry, as well as other census tracts with similar socio-economic and racial mixes. All the comparison groups were age adjusted to allow calculation of expected cancer rates in the control and target populations. When this was done the likelihood of dying from cancer in the specified block was less than for any other comparison block, census tract or group in the community. The CDC and NIH confirmed these results. Everyone was satisfied except the complainant. Unfortunately, good data rarely changes opinions based on irrational beliefs. This incident, however, underscores the need for careful data analysis, and knowing how to find data to analyze.
Once you have identified the major health and environmental problems in the community you need to track them. Describe the number of people affected by race, sex, socio-economic stratum and any other relevant variables. Describe the rates, incidence, and prevalence of health problems as well as the numbers at risk of disease from environmental hazards. Although we use the entire population to figure out birth rates; fertility rates, by convention, are calculated using only the number of women between 15 and 44. Fertility rates are better indicators of risk of new births in the community by excluding infertile women from the denominator. The calculation of fertility rates exemplifies the problem of finding purely homogeneous groups of persons to serve as denominators when calculating rates. Because of hysterectomy and sterilization some permanently infertile women will be included in the denominator. This is the type of compromise that often has to be made when you use the only data readily obtainable that is comparable from community to community. Next, you have to determine what levels of intervention are available to prevent, modify or cure a disease. You can prevent measles by immunization; modify arteriosclerosis by diet and cure tuberculosis with antibiotics. Each intervention requires a different approach, effort and measurement of success. The plan also requires estimates the proportion of those exposed to your intervention that will accept the offered care. When setting the objectives you must also evaluate barriers to care such as cost, access, and available services.
Community health priorities.
When the data have been identified you can develop an initial set of priorities and estimate the public's desire for the department to intervene and improve health status. You may believe that stopping all tobacco use will be the best return for effort, but the community may be prepared only to limit exposure in public places, not to change individual behavior.
Many children may be at risk for measles, and the cost of immunization may be relatively small. Only 2 immunization are needed one as an infant and a booster as a teenager). It is easy to reach children on entry to day care centers or school. You know, from historical data, the costs of measles in terms of medical care, deaths, chronic disabilities, and long-term support. Similar analyses can be made for other childhood infectious diseases.
Many people will be infected with gonorrhea, but reporting by doctors has never been good. Many people see this disease as a punishment for sinning. Only grudging support, if any, will be given to efforts to control rather than eliminate the disease.
An example of a disease specific goal comes from Portsmouth, Virginia in 1969, where tuberculosis rates had been determined by socio-economic area. This example shows the 1969 goal and the outcome three years later, where the slide shows that the target was met for each socioeconomic area. The results were clear; they gained support in the community from clear planning and goal setting. Though the entire set of objectives had not been reached, sufficient progress was made to justify increased efforts and associated budgets in following years.
Although such objectives to control infectious diseases and receive support may seem clear each community has limited resources, for which you compete. Sometimes, national and state laws set your objectives. Regulations may require certain health interventions such as immunizations for foreign travel, immunization against childhood diseases, permits for installation of sewage systems or provision of public food services. There are laws, which require collection of vital data used for school, community growth and economic projections in addition to health analyses. Most states have policies to deliver maternity and child health services. When such activities are required by law they will be high on your list of priorities, though all the resources necessary to carry of the objectives supporting the goals may not be available. One purpose of planning is to set priorities and objectives that move you part of the way toward your own and imposed goals.
Some goals and programs are funded by federal, state, or local government, or by foundations. Some of these programs are mandated by federal or state law, while others are required to reduce local health problems and may be considered optional. An example of a program without state or federal mandate is mosquito control. Communities in subtropical climates around the Gulf of Mexico have areas where frost is rare and mosquitoes breed the year round. Corpus Christi and Houston have had several well-documented outbreaks of St Louis encephalitis, transmitted by mosquitoes breeding in storm sewers. This mosquito requires different control measures from others. Local ordinances dictate year round control and provide funds for control efforts.
Once you have identified all the community's health problems and developed goals and objectives divide them into four groups:
Community health goals and the national priorities.
Depending on your community's priorities and funds available it may be more important to work with private or non-profit organizations, such as the Cancer Society, Red Cross, or Lung Association to meet the community's health objectives, than by providing the service from the department. However, it is the Health Director's job to provide the leadership to ensure progress to meet the community's health goals within the resources available.
Excerpts from Healthy People 2020 describe goals more clearly than in the past. This may be supplemented by the Community Guide, Healthy People 2020 contains hundreds of objectives found in many Topic Areas which makes it unwieldy to use at the community level. Some of the best examples of prevention are immunization, prenatal care, and fluoridation of water. The latter, with improved nutrition, has been followed by closure of several dental schools. Among the best example of health promotion is blood pressure control education. Reduction in smoking, and weight control unfortunately, have had little effect in producing permanent changes in behavior, measured on a national scale. The best examples of protection are potable water and waste disposal programs. Among the successes of medical intervention are 'pap' smears to control early cervical carcinoma-in-situ, use of emergency medical services to stabilize and transport injured persons, and prevention of late effects of diabetes by strict control of the disease. The Healthy People 2020 publication has just become available and is another useful reference guide.
Cost-Benefits
The final steps in completing the community health plan involve cost-benefit analyses to make final decisions about priorities. Examine how the population at risk that may benefit from each program. Determine the likely numbers of interventions needed, such as immunizations, prenatal care visits per client, treatment for gonorrhea, or numbers of food service facilities, and the likelihood that each additional intervention will reduce health care and social costs. Each of these actions can be priced.
When these steps have been completed you are ready to write the goals and objectives for each program, and place all the programs in priority. These priorities must include not only clinical, educational, and environmental interventions but support services such as administrative, facilities and equipment. These must be combined into a single document, which can be used to develop a budget.
Selling the department.
When describing the department's priorities be sure to tell the whole story. Regarding prenatal care for instance, discuss the probability of preventing maternal morbidity, maternal deaths, and distress and injury to the fetus. Use historical data to show what might happen without the program. For example, describe how the prenatal programs prevent children being born dead and how they reduce the likelihood of abnormalities associated with poor nutrition and use of alcohol, tobacco and other drugs. Discuss the increased cost to other agencies such as social services, mental health, and education when a child is born with less than optimal outcome. Explain how a defective child may need full or partial support for the next 70-80 years. You should review the objectives from the MCH portion of Healthy People to examine recommendations that can be used in your community assessment analysis. Also discuss the costs of neonatal intensive care units for children born too little or too early. Statements of priorities should point out the costs likely to be incurred if programs are not funded. The midcourse review shows how periodic assessment of goals and objectives leads to modifications, and should be a part of all community assessments.
Because many younger elected officials never saw the health problems caused by poliomyelitis, measles, and rubella infections you may need to explain the successes from immunization for these diseases to validate the need to maintain immunization programs. When you have to present your plans in public, before your city council or county board, it may help to have some parents present whose children had bad outcomes or death from previously common childhood infections. Their presence will add personal visibility to your presentation of scientific data and statistics. You may wish to refer to the costs of recent outbreaks of measles, found even in highly immunized populations, and to note the extreme communicability of this disease which does not even require the carrier and infected person to be the same room at the same time.
Similarly, when looking at costs associated with food service programs, discuss the costs associated with hepatitis-A, salmonella, and staphylococcal and ptomaine food poisoning outbreaks. Not only for the sick person, but also the effects on the reputation of the restaurants affected, and whole vacation communities are relevant.
Even in times of fiscal distress health departments that present their programs, goals, and objectives clearly and with conviction will get their fair share of available support [funding] from the community. Good and effective use of community epidemiology to set goals and objectives is a major priority for every department of public health.
Finally most other countries are far ahead of the US in developing and tracking goals and focusing on the health of the population, rather than the diseases. For examples look at
The NHS – UK Principles
Health Canada Mission & Vision
European Health Plan 2008-2013 and Public Health (Feb 2014)
Recommended Reading: